How one scientist’s gut microbes changed over a year
Where you live and what you eat can rapidly affect the types of friendly bacteria inhabiting your body. To see how the microbes that inhabit the mouth and intestines change over time, Duke University computational biologist Lawrence David zealously chronicled his microbiome for an entire year. (For more on David and this experiment, see “Lawrence David’s gut check gets personal.”)
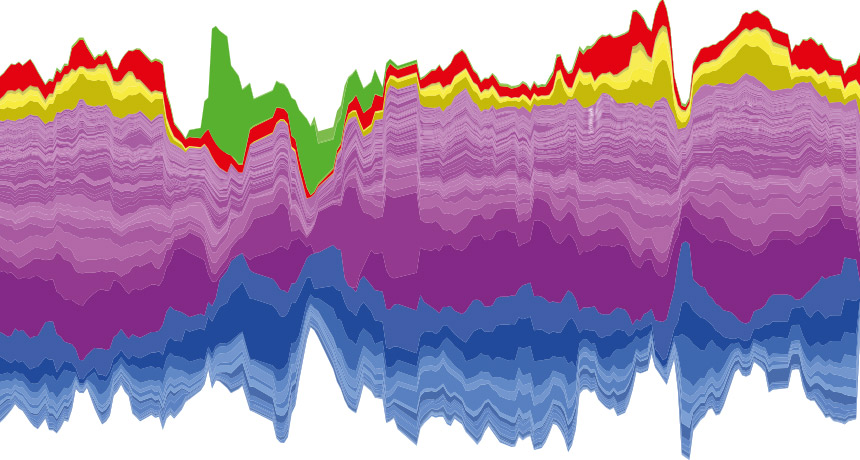
A stream plot (below, top graph) shows the ebb and flow of phyla of bacteria in his gut over time. The thickness of each stream indicates a bacterial group’s relative abundance in daily fecal samples.
David peered closer at the data in a horizon plot (above, bottom graph; colored squares at left indicate the phylum of the bacteria represented in each row). He first determined each type of bacteria’s normal abundance in his gut, then calculated how much they differed from the median abundance. Warmer colors (red, orange, yellow) indicate that bacteria in that group increased in abundance, and cooler colors (blue, green) indicate a decrease in abundance. Living abroad from day 71 to day 122 had a dramatic — but short-lived — effect on David’s microbiome.